How to run a Monte Carlo simulation in RiskChallenger?
In this blog, we’ll walk you through how to run a Monte Carlo simulation in RiskChallenger.
Monte Carlo simulations allow users to move beyond static risk scores and explore how uncertainty truly behaves within a project. By running a simulation, you gain deeper insights that support more informed and confident decision-making.
In this blog, we’ll walk you through how to run a Monte Carlo simulation in RiskChallenger. This guide will show you how to prepare your risk data and configure the simulation settings so you can get the most out of your analysis.
Step 1: Prepare your risks
Before running a Monte Carlo simulation, you need a set of risks that have impact and probability values. At minimum you need to have:
- Access to a project inRiskChallenger
- A risk register with defined quantifiers (such as: financial costs or time delay)
- Clarity on which quantifiers should be simulated
Step 2: Configure the simulation settings
In this step, we will walk you through the configuration of a simulations in a RiskChallenger way: Let's make it visual!
Step 2.1: Open a risk file and click on the Monte Carlo icon

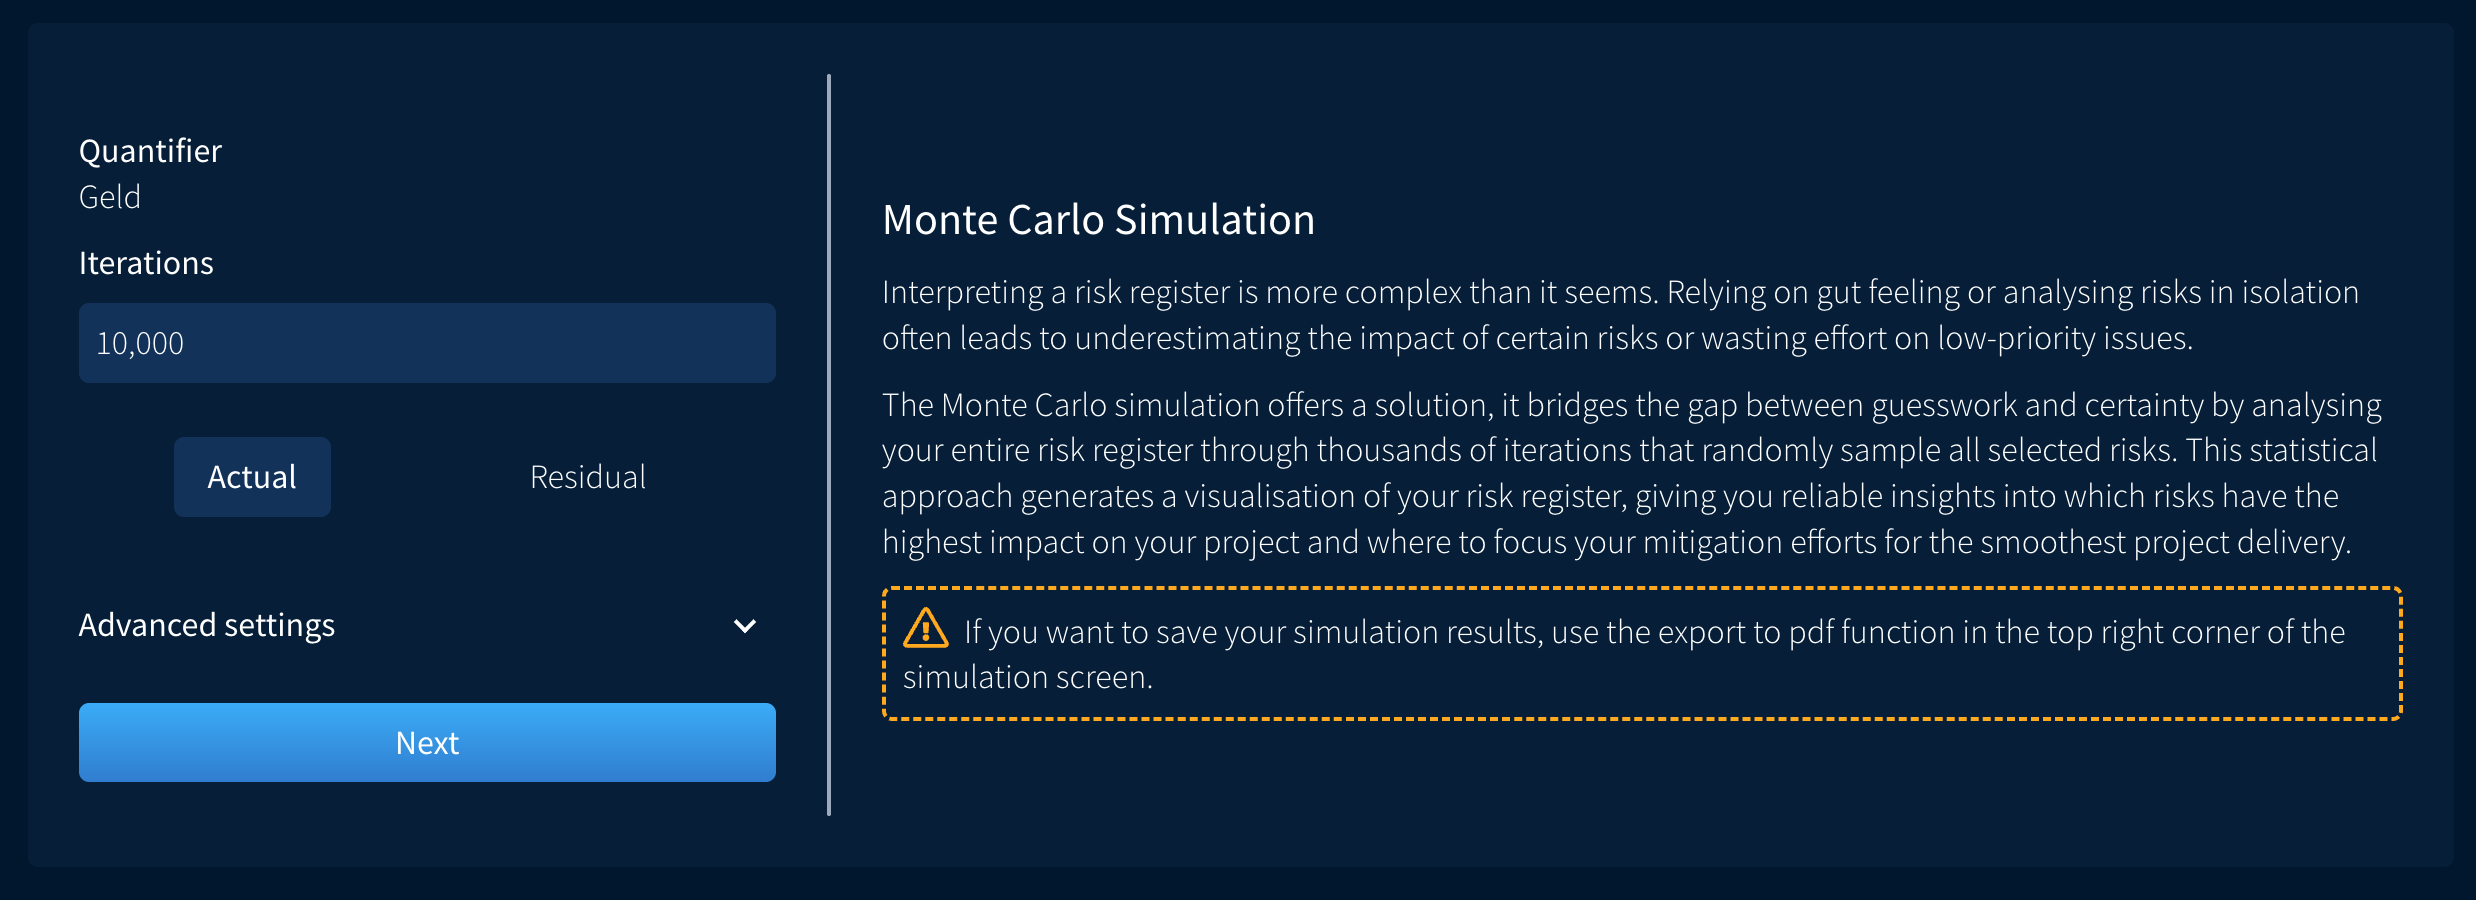
Step 2.2: Once you click the icon, you will be met with a screen that contains:
- An overview of the quantifier you are running a simulation on
- A text box to select how many iterations you want to include (we currently support up to 10.000 iterations)
- An option to choose between actual and rest scores
- An option to make use of scenarios in the simulation
- A brief explanation of what is a Monte Carlo simulation
After making your choices, click on the “Next” button.
Step 2.3: Using Scenarios (if you do not wish to use scenarios in your simulation, head to Step 2.4)
- Scenarios allow the user to analyze a specific range from the Monte Carlo simulation. This helps with budget-related decisions.
- In the scenario setup screen, you can find the following:
- More details into what scenarios are and how to interpret results
- Fields to add the minimum and maximum value to each scenario (you can use up to maximum of five scenarios)
- Once you define the specific ranges you want to look more in depth at, click on the “Next” button
Step 2.4: Selecting risks
In this step, the user needs to select which risks to perform the analysis on. There are three different ways risks can be selected:
- Select/Deselect all
- Using the risk filtering function on the left-hand side (for example sorting per project phase/theme of the risk/risk allocation)
- Manually selecting them
Once you are satisfied with the selection of your risks, click on “Next” button
Step 3: Running the simulation
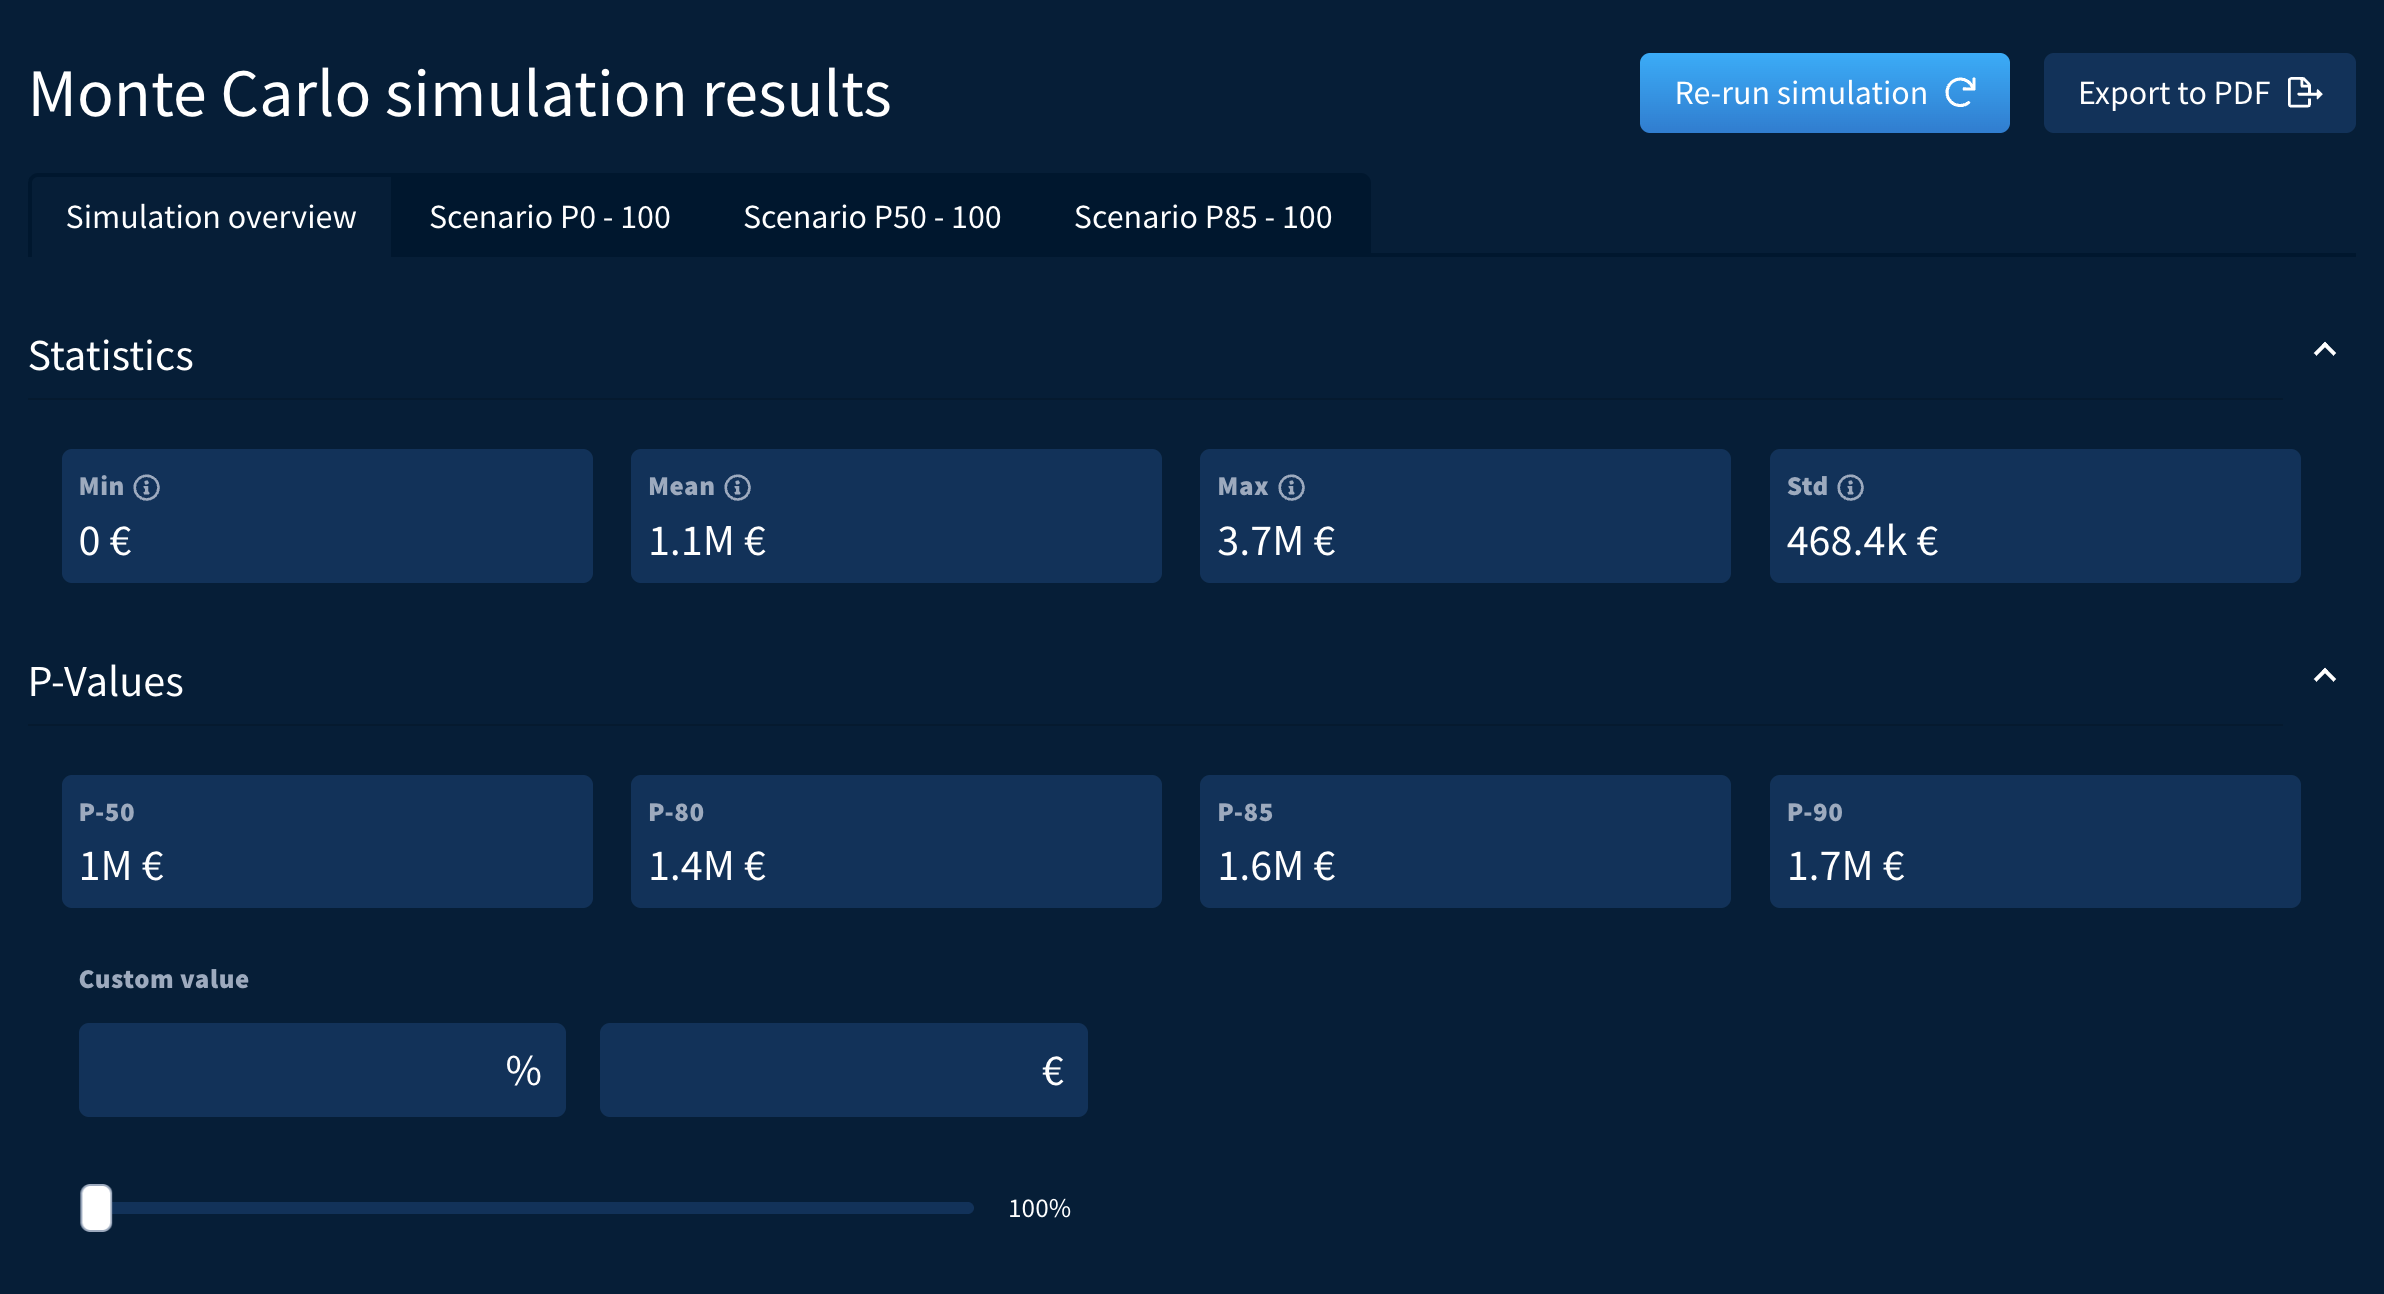
Now that all preparation work is complete, you can start running the simulation. Simply click “Run Simulation” to generate the results. Let’s walk through what you’ll see.
At the top of the results page, you’ll find an overview of various statistics and P-values. If you want to view a specific P-value, you can enter it in the input field to generate a tailored result. When working with scenarios, you can easily switch between them using the tabs at the top of the overview.
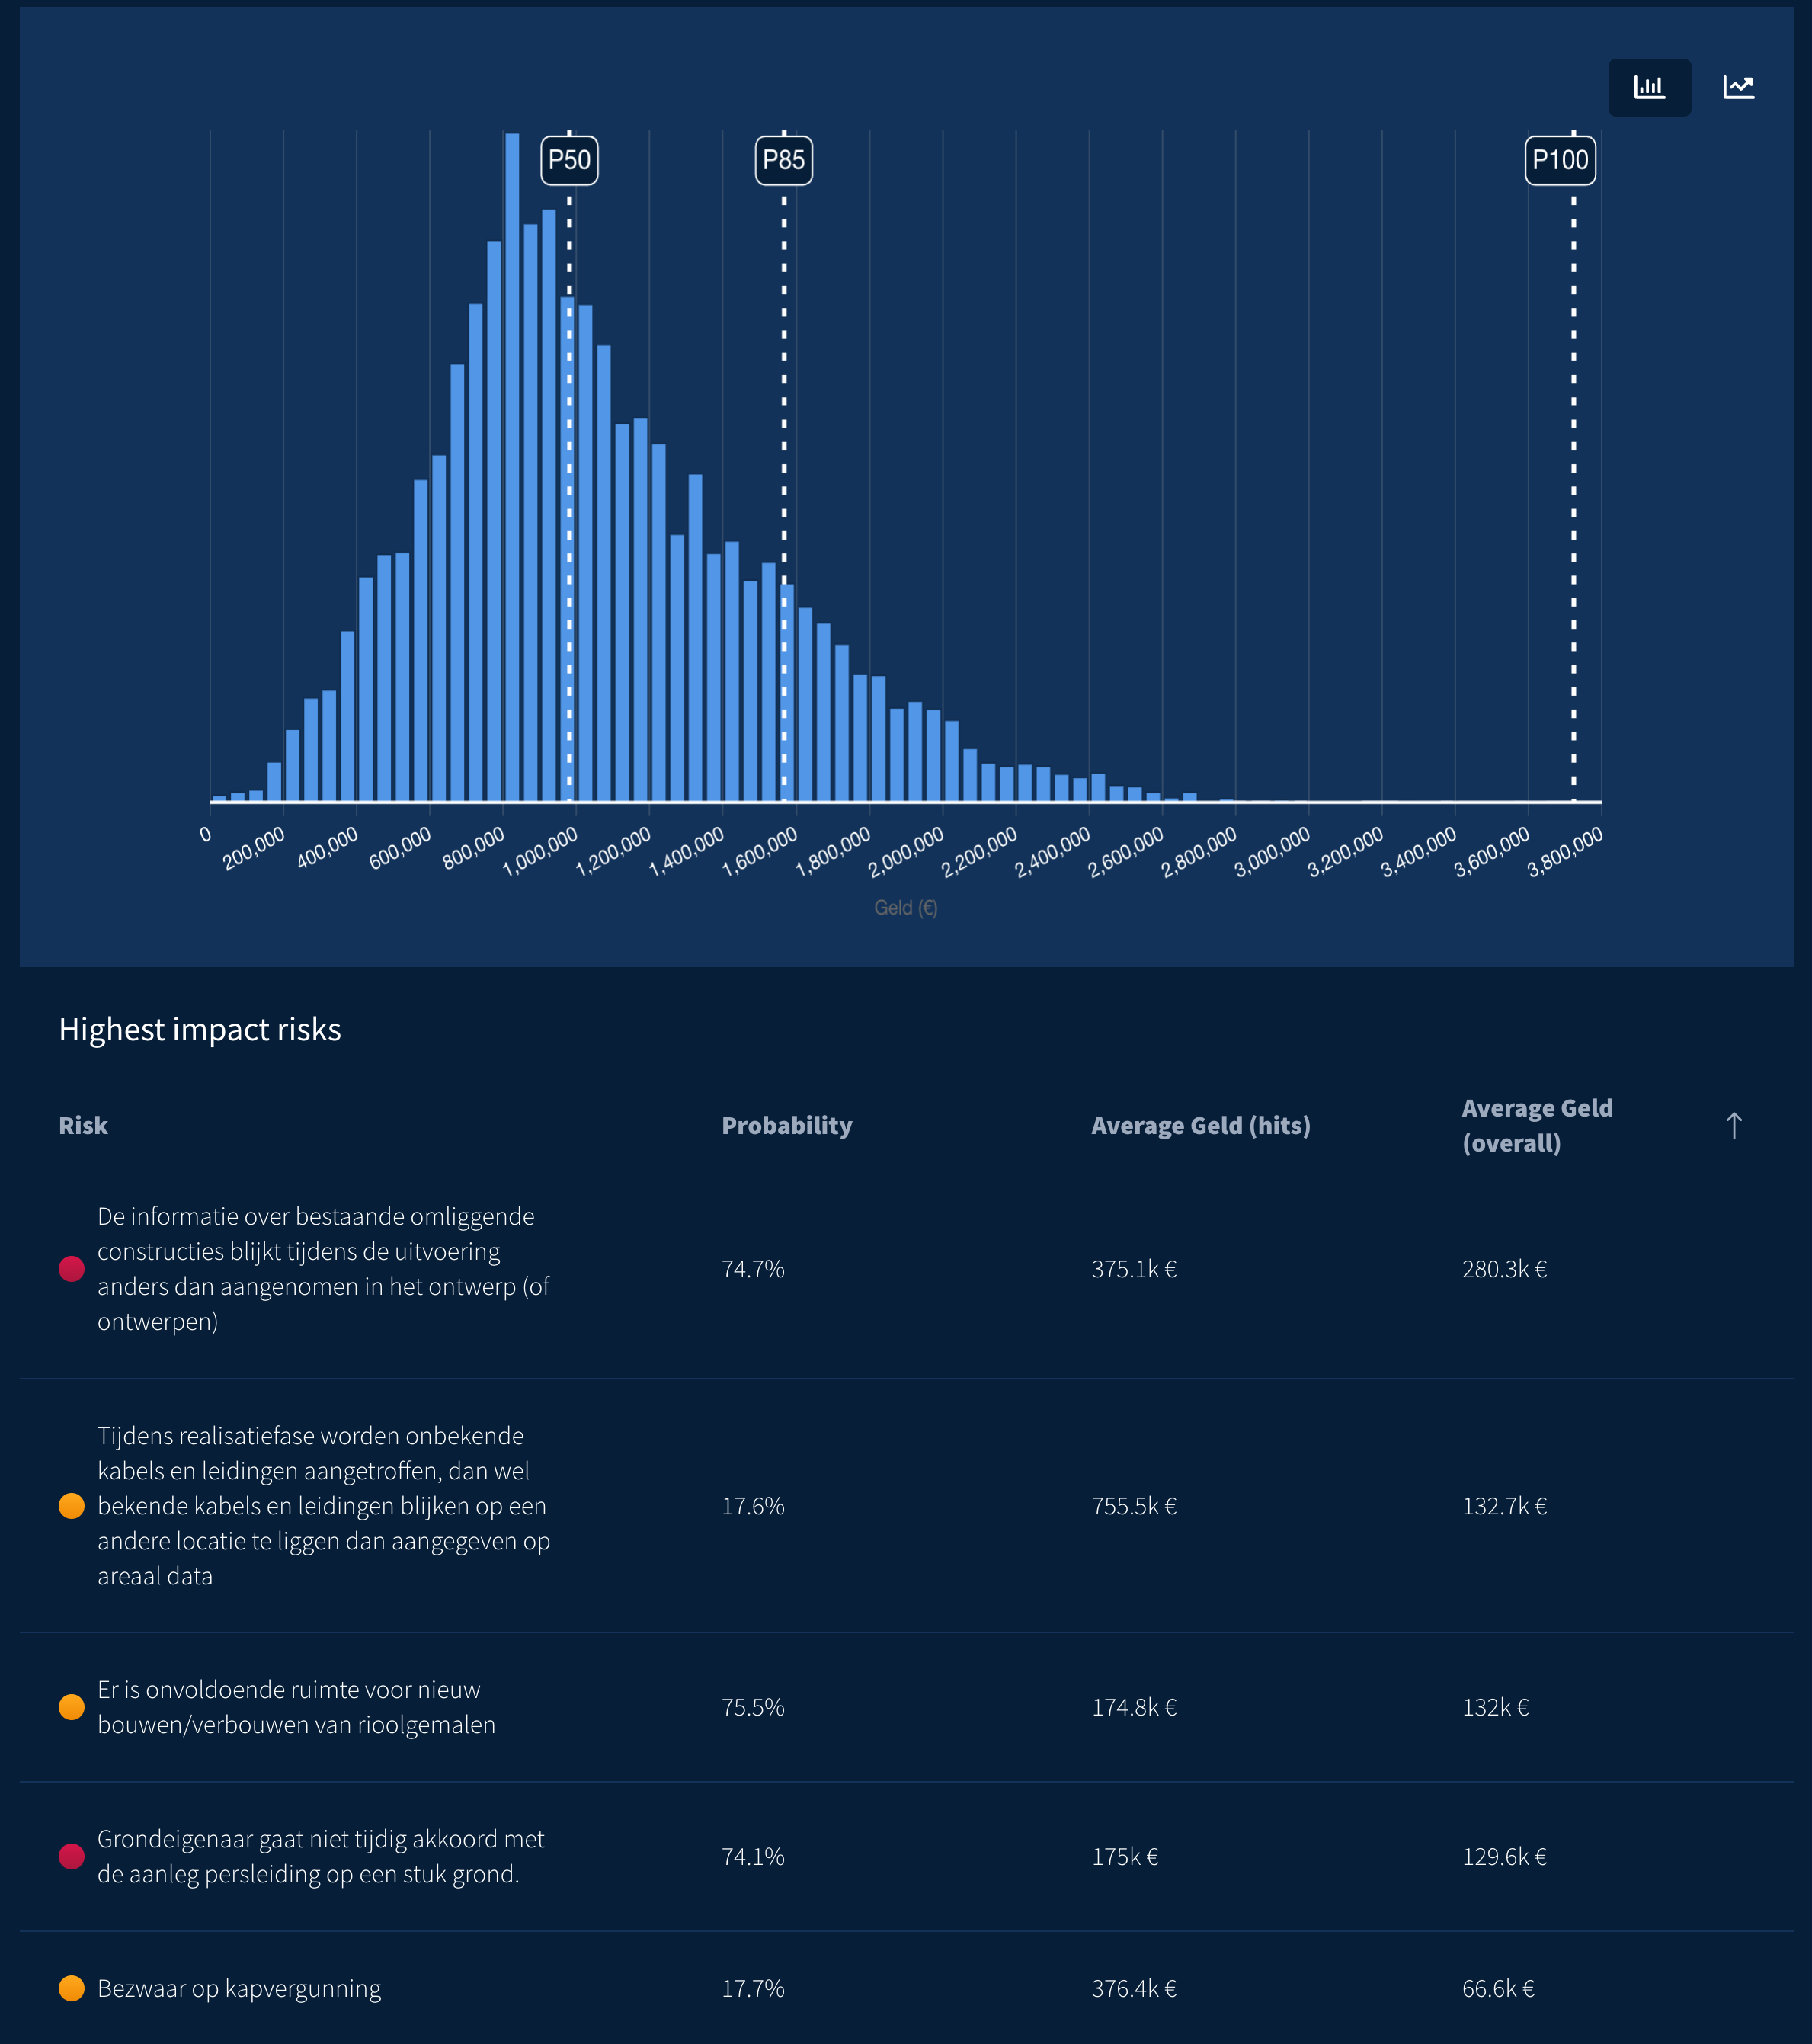
If you scroll below the overview, you will find the main diagram, where you can switch between a histogram view and an S-curve. Below the chart, you’ll also see an overview of the risks with the highest impact, including their significance across different scenarios.
Step 4: Exporting the results
You can of course export the simulation results in a PDF. There are multiple options you can choose from:
- Export all risks included in the simulation
- Export the top risks. You can choose between a default of top 10, top 5, or a number of your choice
- If you choose a set amount of risks, you also have the option to include the other risks in the appendix.

In the PDF export, you can find the following information:
- Cover page with information about risk file of choice, the quantifier, the scenarios used among others
- The graphs: both the histogram and S-Curve
- The statistics and P-values, either based on the scenarios or the one of your choice
- The list of risks based on highest impact
- Sub-reports based specifically on the scenarios
- Rest of the risks in the appendix, with their values
We hope this blog has helped clarify how to use the Monte Carlo simulation feature in RiskChallenger. Curious to learn more about what Monte Carlo simulations can support? Then feel free to read our related blog: Monte Carlo Simulations available in RiskChallenger.
Do you have any questions about this article?
Feel free to contact us via live chat or via
support@riskchallenger.nl